Modernizing Risk Assessment for Legacy Products

Legacy drug products developed before the U.S. FDA’s 2011 Guidance for Industry: Process Validation: General Principles and Practices have not undergone the same rigor during development as newer products. This divergence has adversely impacted business through an increased number of product failures, market complaints and product recalls that have further affected the credibility of pharmaceutical companies.
To remedy the situation, organizations must develop a methodology to bring their legacy products up to par with the quality standards imposed on newer products. They must reexamine the role of continuous process verification (CPV) to help manage their legacy products and process knowledge, from development through commercialization to discontinuation.
Regulatory Guidance
A paradigm shift in the thought process has come about with respect to the product lifecycle. It began with the process validation lifecycle guidance issued by the FDA in 2011, which divided the product lifecycle into three stages – product design, process qualification and continuous process verification – sounding the call for forward and backward transmission of information across stages. In 2014, the European Medicines Agency (EMA) provided similar guidance. In November 2019, the International Council for Harmonisation released Quality Guideline Q12: Technical and Regulatory Considerations for Pharmaceutical Product Lifecycle Management. The most current update from the FDA on quality management maturity (QMM), White Paper Quality Management Maturity: Essential for Stable U.S. Supply Chains of Quality Pharmaceuticals, was released in November 2022. (See Figure 1.)
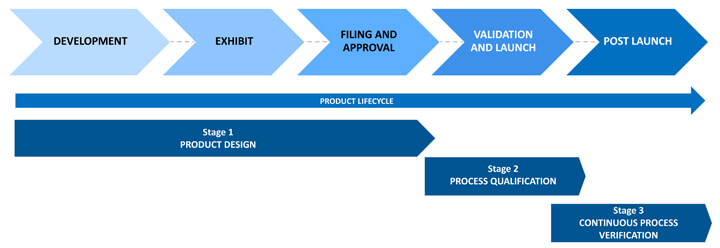 Figure 1 Stages of the Product Lifecycle
The figure above outlines how quality should be built into products and quantitively demonstrated. The FDA published its initial QMM recommendation when there was a severe shortage of drugs because of a lack of quality products being developed and marketed by pharmaceutical companies. This is the primary reason for enforcing quality metrics to ensure product, process and system robustness. While not yet mandatory, it will eventually become a basic requirement in pharmaceutical manufacturing.
Through the QMM recommendation, companies are expected to demonstrate a deep understanding of their products, not just from a system maturity point of view. The FDA hopes the possibility of reduced inspection frequency will incentivize companies to voluntarily rate their products and processes using critical quality metrics. The FDA does not specify these metrics. Organizations can define their own.
Figures 2-4 illustrate a methodology for arriving at the product score, which involves calculating the robustness score based on the process performance capability (Ppk). Ppk is a weighted average of all the critical quality attributes (CQA) associated with the product. The weightage is calculated via relative ranking of the factors against each of the CQAs on a scale of 1-5.
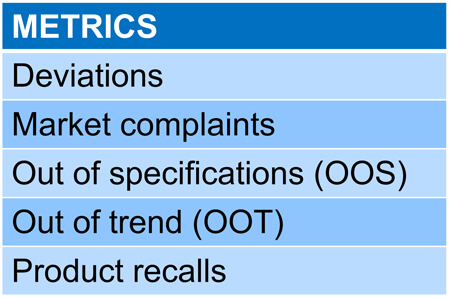 Figure 2 Defining the Metrics
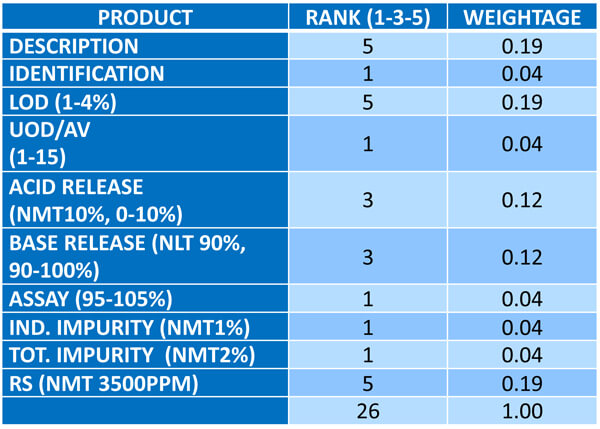 Figure 3 Calculating the Weightage
In addition to the above, the FDA could ensure flexibility in approvals during post-commercial changes. It currently takes two to three months to get FDA approval on filed minor variations to be made to a product. Following the QMM recommendation, however, the approval timeline could be reduced to a couple of days, helping companies get critical products to market faster. Such advantages benefit the industry as a whole.
The recommendation further emphasizes that the same quality metrics must govern legacy and new products. Products developed after 2011 were formed through a quality-by-design (QbD) development program where quality was built into their design. Unfortunately, products developed before the 2011 guidance have not undergone rigorous development in terms of optimizing processes and formulations. Therefore, companies must develop a means to elevate legacy products to the quality standards imposed on new products.
Most FDA citations pertain to a lack of product and process understanding concerning legacy products. Companies may have upgraded their systems and revised their validation standard operating procedures, but failure rates have increased with legacy products running on these systems. Out-of-specification-related rejections are common, but the root cause is rarely identified. Audit citations show that in addition to low product understanding, no proper investigation program can examine why products fail.
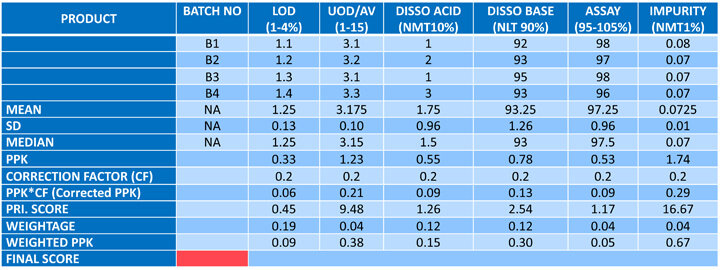 Figure 4 Product Score Card Illustration
Legacy Product Impact on Business
Many products were developed before 2011 when critical material attributes (CMA) and critical process parameters (CPP) were not well-established or well-defined during development. This is the main challenge.
A second challenge concerns the retrieval of development data. A product a company developed decades ago may no longer employ the original developers. Documentation may not exist in a digital format. Traceability becomes difficult, and the challenges of defining areas of improvement for that legacy product escalate.
The good news is that well-established legacy products will have produced a colossal amount of data. Companies can use this existing data to generate and define product criticality. Hence, QbD would be determined based on commercial batch data rather than development batch data.
To make sense of this expansive data set, we need robust risk assessment mechanisms to help us understand critical parameters affect on CQAs or CMAs that further impact product quality. Hence, risk assessment and statistical evaluation technology are essential for assessing the robustness of legacy products.
Improving Legacy Robustness through Continuous Process Verification
How can we ensure that legacy products are governed by the same quality metrics as newer products? This six-step approach could guarantee it. (See Figure 5.)
(1) Product prioritization: Identify the most critical legacy product(s) for remedial action. We can use multiple criteria to prioritize products.
Select products:
- where the product failure rate is higher, or process capability is less
- where similar types of overwear are repeated
- where the yield is less
- that have undergone major formula or process changes in the recent past
- with high batch annual manufacturing volumes (where the potential for batch failure is high)
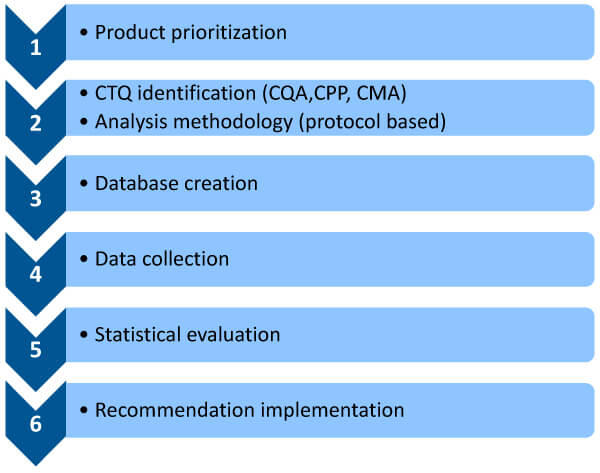 Figure 5 Six-step approach for continuous process verification (CPV) of Legacy Products
We can create a risk assessment program by allocating percentage ratings to these criteria in terms of criticality, thus prioritizing products for remedial action. (See Figure 6.)
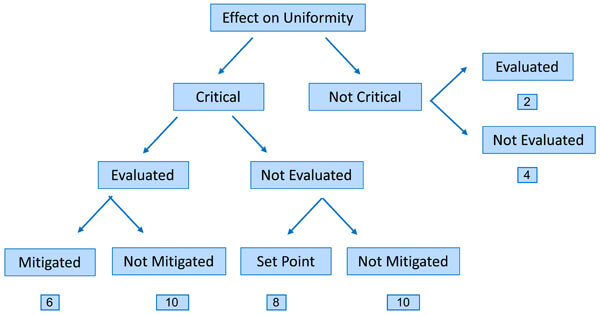 Figure 6 Risk-Rating Method
(2) Critical to quality identification and a protocol-based analysis methodology: A criticality assessment must be performed with respect to CQAs, CPPs and CMAs. Assessment tools, such as risk priority number, failure mode and effects analysis, fishbone diagram and others, could be used to list and provide criticality ratings (high, medium or low) for all quality attributes while providing a rationale for these ratings. The ratings should be based on three criteria: safety, efficacy and quality. We can then develop a protocol-based criticality assessment document to identify key process parameters or material attributes we want to focus on.
(3) Database creation: A legacy product generates volumes of information that can be gathered from various sources, such as batch manufacturing records from the shop floor, lab-generated data, input raw material data and equipment data that may not have been captured in the batch record but could prove important. All this data must be brought to a single platform, which is where a digital CPV tool can play a significant role. Much of this data can be garnered from the annual product quality report (APQR), but the drawback is that the data comes from scattered sources and may not have been acquired digitally. To study data, we need a digital tool to collate and interpret it.
(4) Data collection: To perform such a study, it is necessary to consider all the data available. This is achieved by checking the registration dossier, the subsequent notifications, all production documents (e.g., batch records) and all quality documents (annual periodic reviews). Various documents can be evaluated for data collection —certificates of analysis, APQRs, batch production records, stability data, a summary of incidents, deviations, out-of-specifications (OOS) and a summary of yield.
(5) Statistical evaluation: The collected data must be processed to glean meaningful insights. We can obtain quality metrics, such as lot acceptance rate, number of complaints, valid OSS rates, stability failure rates, number of recalls, number of invalidated OSS, number of deviations and CAPA effectiveness from the APQR. Metrics that can be taken from batch records include trending process parameters and minimum/maximum ranges the product operates on, among others. Another metric is input raw material, for example, material attributes, specifications, active pharmaceutical ingredients, OSS, deviations and environmental monitoring data. These metrics must be collated and statically evaluated with the help of statistical evaluation tools to garner critical insights about a product, especially where there are maximum batch failures. Hence, data collection, data processing and data interpretation are imperative to help make informed decisions concerning a product.
(6) Recommended implementation: In this final stage, we must set some predetermined criteria, such as a defined confidence interval of process capability (e.g., Cpk > 1, with 90% confidence), which, when achieved, would drive a review to decide if and what testing could be reduced to the routine monitoring level, and which elements of the control strategy could be considered for change. (See Figures 7 and 8.)
For a product to remain efficacious and safe, risk assessments must be performed throughout its lifecycle. Unfortunately, this is often a manual activity, making it impossible to determine the historical changes made to the product over time. Therefore, modern software tools are necessary to reveal product genealogy.
Some of today’s cutting-edge digital CPV risk assessment and evaluation tools help assess risk, interpret data, map processes and implement CPV while managing a product’s lifecycle. These tools handle legacy products by capturing data from previous batches and providing the insight needed to update older products and processes to current guidelines.
Digitizing the risk assessment process is the only way companies can source, collate and intelligently interpret product data in real time to apply QMM guidelines. As legacy products are often key revenue drivers that fuel new drug development, modernizing their risk and validation processes ensures their viability and enables future generations of employees to produce a product with the same level of reliability and profitability.
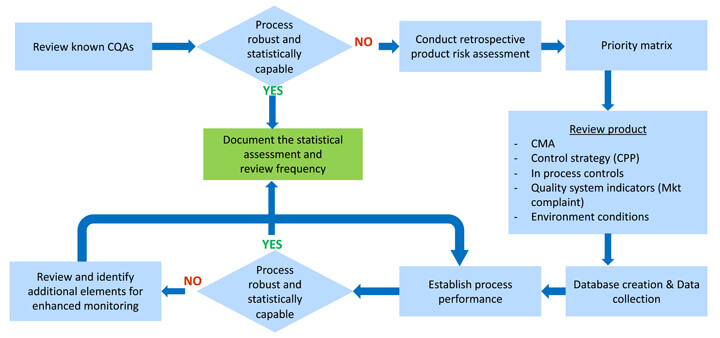 Figure 7 CPV Monitoring Program for Legacy Products
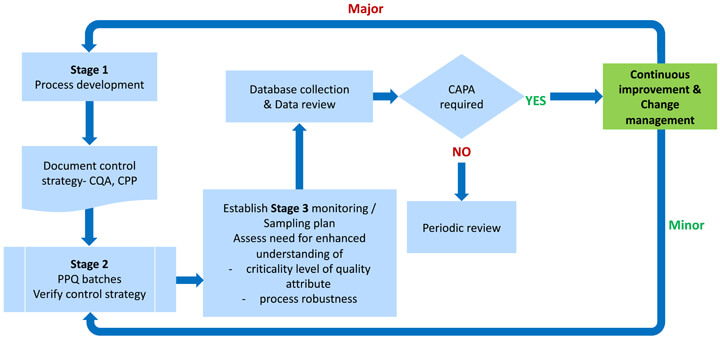 Figure 8 CPV monitoring program for new products
Reference
- FDA Guidance for Industry – Process Validation: General Principles and Practices January 2011.
- FDA Guideline on General Principles of Process Validation – May 1987.
- FDA Guidance for Industry Update - Process Validation – White Paper, PharmOut.
- Lynn D Torbeck, Validation by Design, 2010.
- Assessing Legacy Drug Quality – Pharmaceutical Technology, July 2021, Volume 45, Issue 7 6. The Minitab Blog.
- ASTM & ICH Standards and Guidelines.


 Sanjay Sharma is the Vice President & Global Head of Technology Transfer (Formulations) at Lupin. Sanjay is a pharmaceutical industry leader with more than 21 years of experience developing, launching and maintaining drug supply. His results-oriented approach and application of technically sound pharmaceutical manufacturing science have enabled some of the largest organizations deliver critical revenue targets. Sanjay worked in several Indian and MNC pharmaceutical firms, namely Cipla, Dr. Reddy’s Laboratories, Sandoz, Watson, Zydus and Torrent.